


Racklog (Racking defect log)

توضیحات Racklog (Racking defect log)
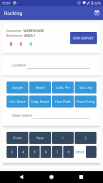
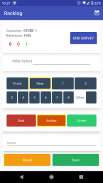
Using the component type, position and severity buttons you can quickly and easily carry out your warehouse racking inspections, recording the results electronically as you identify them.
Entering the data as you go along saves time and eliminates the errors that can easily occur when having to type up any handwritten notes after an inspection. As you progress through the inspection, there’s a screen tally of the defects in green, amber and red categories.
If you make an error, this can be easily rectified by editing the data at the time, even if you’ve already saved the entry.
If you switch off your device mid inspection, or the battery runs flat, the survey will still be recorded and available, on screen, as soon as you recharge, reboot and then reselect the app.
The Racklog outputs to an excel spreadsheet that can be easily added to and then analysed, using charts, graphs or pivot tables; you can easily add any additional “action” columns that you need. The spreadsheet can then be added to larger documents, reports and presentations at any time or can be used to build up a picture of your racking damage over a number of years.
This information can be used to focus on near-misses, protection and can highlight areas where additional focus needs to be applied.
Go to www.racklog.co.uk for further information on using the app.


